

ABC analysis splits your products into three groups by how much they contribute: group A is the items that together bring the first 80% of profit or revenue, B the next 15%, C the last 5%. It takes four steps: sort products from the largest result to the smallest, calculate each one's share, add the shares up as a running total, and assign a group at the 80% and 95% cut-offs.
The most common mistake is running ABC on revenue and using it to decide which products matter. An expensive item with a thin margin comes first by revenue and nowhere near first by the money the store keeps. Below are the Excel formulas, one ten-product example calculated both ways, and what to do with each group.
When stores run an ABC analysis
Usually the catalog has grown to a few hundred items, cash is tied up in stock, and nobody can say which products actually pay the bills. The owner searches for "abc analysis", then "abc analysis example", "abc analysis in excel" and "how to read abc analysis".
The real question here is not "how to calculate" — that is four formulas — but "what to calculate it on". That choice decides which products end up in A, and getting it wrong costs more than a typo in a formula.
What ABC analysis is and what it is based on
ABC analysis is based on the Pareto principle: a small share of items produces most of the result. The method does not claim the split is always exactly 20/80; it simply ranks your products and shows where the line falls in your own catalog.
The most common cut-offs are 80% and 95% of the cumulative share:
- Group A — products that together bring up to 80% of the result. There are few of them, and each one matters.
- Group B — the next ones, up to 95%. Medium importance.
- Group C — everything else, the last 5%. Usually the largest group by count.
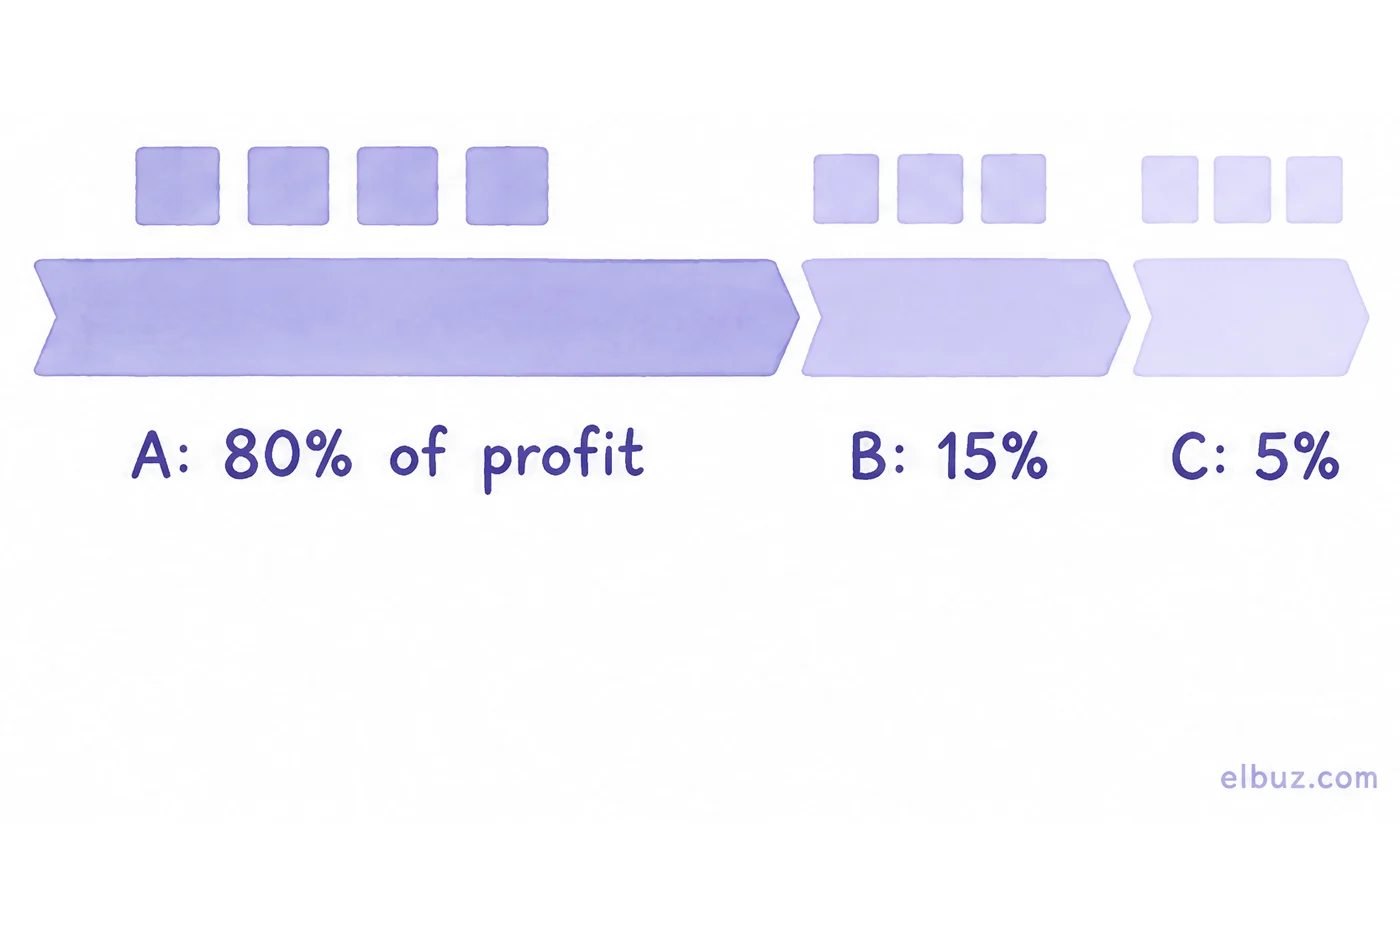
The cut-offs are a convention: whoever runs the analysis picks them, and the main thing is not to change them from one report to the next, or the groups cannot be compared. ABC works the same way for customers (who brings most of the revenue) and suppliers (where most of the purchasing goes) — the formulas do not change.
What to rank by: revenue, profit or units
For assortment decisions, rank by gross profit: it shows which products earn money. Revenue and units answer different questions.
| Criterion | Question it answers | Where it misleads |
|---|---|---|
| Gross profit | Which products earn money | You need the cost of every product; without it the calculation is impossible |
| Revenue | Which products drive turnover and load the warehouse and shipping | An expensive item with a small margin lands in A |
| Units sold | What gets picked and shipped most often | A cheap add-on item lands in A |
| Annual usage value (units × unit cost) | Where the purchasing money goes — the classic warehouse version | Says nothing about margin: a costly item that barely earns still ranks high |
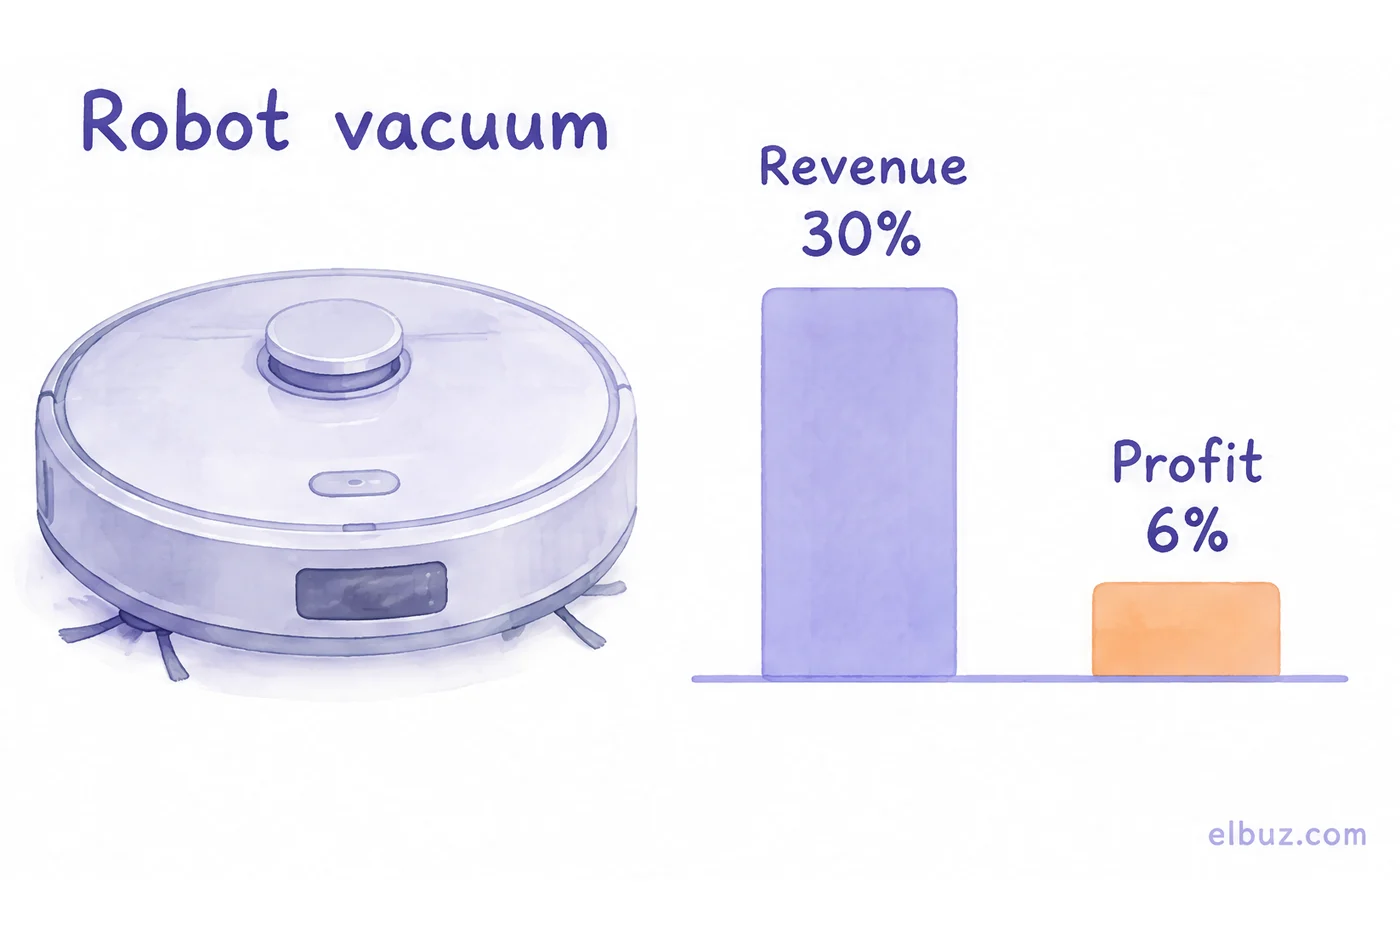
In the example below, a robot vacuum brings 30% of the store's revenue and only 6% of its profit: by revenue it is the most important product, by profit an average one.
How to do ABC analysis in Excel: 4 steps and formulas
You need a table with two columns — product and profit for the period — and four actions. Say products are in rows 2–11, the name in column A, the profit in column B.
- Sort from largest to smallest. Data → Sort by column B, largest to smallest.
- Calculate each product's share in column C and format it as a percentage.
- Calculate the cumulative share in column D: the product's share plus the shares of everything above it.
- Assign the group in column E at the 80% and 95% cut-offs.
Why ROUND: shares are fractions, and at the cut-off their sum can come out not as exactly 80% but as 80.0000000001%. Then the product that closes exactly 80% drops into B. Rounding to four decimals removes that error.
The formulas use a comma between arguments, as in Excel and Google Sheets with US or UK settings. If your spreadsheet uses a semicolon as the list separator — common with German, French, Polish and many other European regional settings — replace the commas inside the brackets with semicolons. The function names are the same in both programs.
ABC analysis example: 10 products by revenue and by profit
Illustrative example for the arithmetic, not market data. A home goods store, ten products, sales for one quarter. Total revenue is €20,000, total gross profit €5,000. The table is sorted by profit.
| Product | Revenue, € | ABC by revenue | Profit, € | Share of profit | Cumulative | ABC by profit |
|---|---|---|---|---|---|---|
| Cookware set | 3,600 | A | 1,400 | 28% | 28% | A |
| Knife set | 2,400 | A | 1,200 | 24% | 52% | A |
| Frying pan | 2,000 | A | 1,000 | 20% | 72% | A |
| Thermos | 1,200 | B | 400 | 8% | 80% | A |
| Robot vacuum | 6,000 | A | 300 | 6% | 86% | B |
| Kettle | 1,800 | A | 250 | 5% | 91% | B |
| Towels | 800 | C | 200 | 4% | 95% | B |
| Coffee grinder | 1,400 | B | 100 | 2% | 97% | C |
| Food containers | 500 | C | 100 | 2% | 99% | C |
| Sponges | 300 | C | 50 | 1% | 100% | C |
By revenue the cumulative shares run like this: vacuum 30%, cookware 48%, knives 60%, frying pan 70%, kettle 79% — that is group A, five products. The coffee grinder (86%) and the thermos (92%) are B, the rest are C.
By profit, group A is different: cookware, knives, frying pan and thermos together bring exactly 80% of profit. Five products out of ten changed group:
- Robot vacuum and kettle: A → B. Plenty of revenue, little margin: the vacuum earns €300 out of €6,000.
- Thermos: B → A. Average revenue, but a third of it is profit.
- Towels: C → B. Cheap, but they earn twice as much as a coffee grinder with nearly twice the revenue.
- Coffee grinder: B → C. €1,400 of revenue brings only €100 of profit.
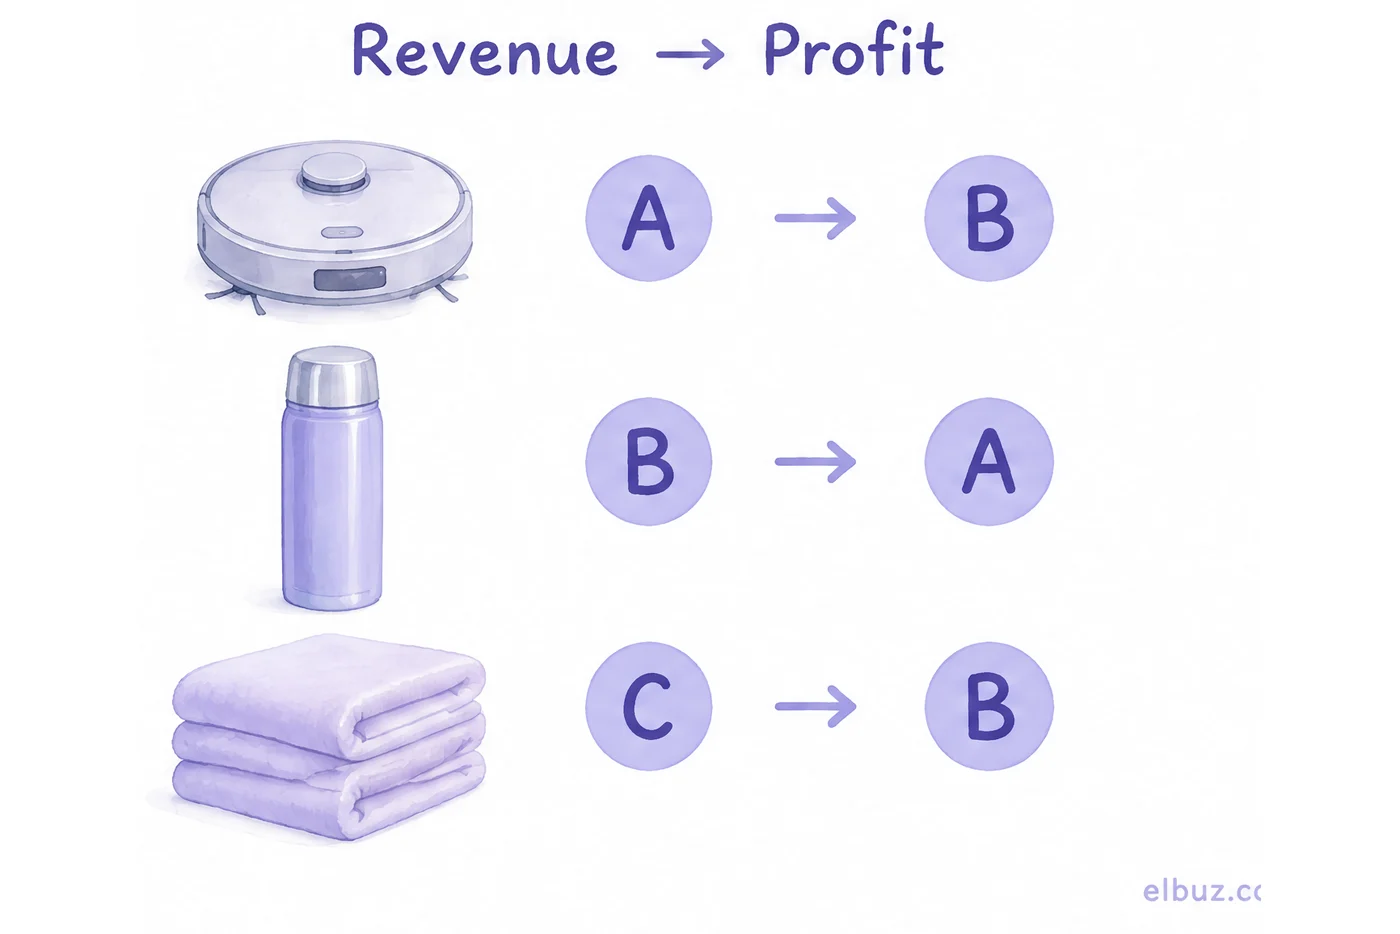
A buyer working from ABC by revenue would keep the deepest stock of vacuums — the product that ties up the most cash and earns 5% of its price. How to calculate each product's margin is covered in gross margin vs markup.
What to do with groups A, B and C
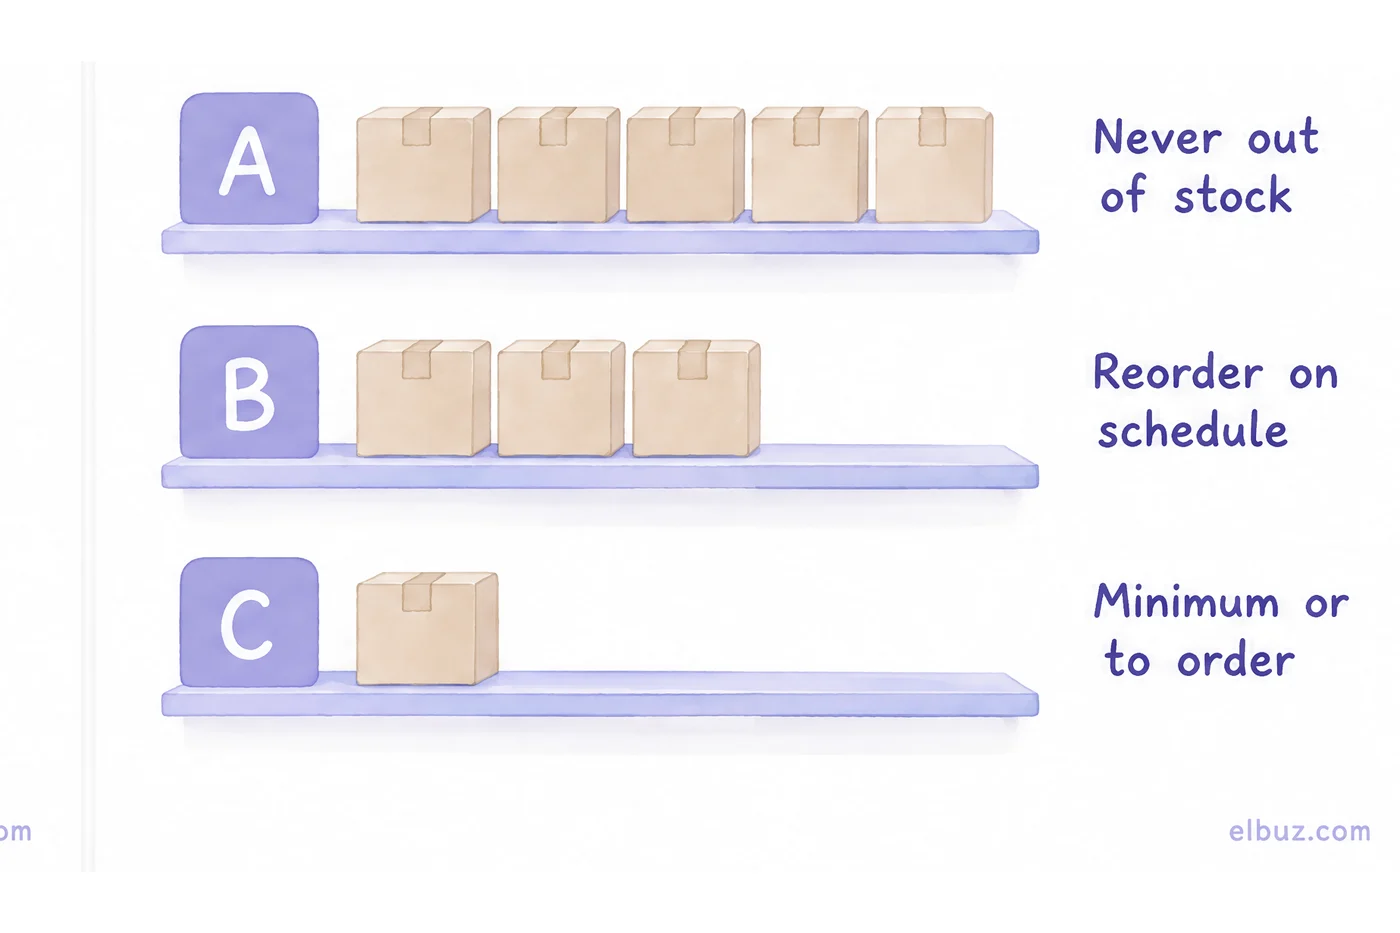
The group decides how much attention and how much cash in stock a product gets: A the most, C the least.
| Group | Stock and purchasing | Price and promotion |
|---|---|---|
| A | Never at zero: safety stock, daily availability check, a backup supplier | Change prices carefully — every percent shows in profit; the best product pages and ads |
| B | Reorder on a schedule, weekly check | Look for the ones that can move to A: price, ads, a bundle with an A product |
| C | Minimum stock, or sell to order from the supplier's warehouse | Check the price; if the item is not an add-on to an A product, it is a candidate to drop |
Do not drop C products blindly. The sponges in the example bring 1% of profit, but if people buy them together with the frying pan, removing them sends part of those baskets to another store. The second thing ABC cannot see is how steady sales are: an A product that sells 100 units one month and 5 the next needs different stock than a steady one. For that, ABC is combined with XYZ analysis — how to do it and which purchasing rule each of the nine cells gives is covered in the assortment matrix.
Where ABC analysis misleads
ABC shows the past period, and you make decisions about the next one. Five situations where the two diverge:
- New products. An item added in the last month of the quarter is guaranteed to land in C. Analyze new products separately or after a full period.
- Seasonality. A quarter with heaters in January and without them in April gives two different groups A. Compare seasonal items with the same period last year.
- Stockouts. A product that was out of stock for a month lost sales and dropped a group. Check whether it sat at zero before cutting its purchases.
- Variants. A T-shirt in five sizes is five rows, and each one alone can land in C. For decisions about the model, roll sizes and colors up into one row.
- Missing cost. Products without a cost price show profit equal to revenue and climb into A artificially. Fill in purchase prices before the analysis or exclude those products.
A separate case is products with no sales at all: they do not even appear in ABC because their profit is zero, yet they tie up cash on the shelf. How to find them and what to do with them is in dead stock: how to spot it and when to mark it down.
When ABC analysis is better done in software
When you have hundreds of products and need ABC every month. Then the slow part in Excel is not the formulas but exporting sales each time, pulling in the cost prices and rolling up product variants.
In Elbuz, the sales analytics report calculates ABC by profit with the 80% and 95% cut-offs for the period you choose: sales come from confirmed orders, the cost from the warehouse or the product record, and products can be grouped by model so that sizes and colors count as one row. What else the report shows is described in sales analytics in the Elbuz CRM.
One honest caveat: the report takes up to the 100 most profitable products of the period into ABC and skips products without a cost price, so purchase prices need to be filled in beforehand, and a full breakdown of thousands of items still belongs in a spreadsheet. If you have a few dozen products, the formulas above are all you need.
Sales analytics in ElbuzOrders, stock and ABC by profit in one system, 14 days free
Frequently asked questions
What is ABC analysis in inventory management?
It is a way to rank inventory into three groups by contribution: A — items that together bring up to 80% of profit or value, B — the next ones up to 95%, C — the last 5%. Group A gets the tightest control and never runs out.
What is the 80/20 rule in ABC analysis?
It is the Pareto principle: a small share of items produces most of the result. ABC analysis does not assume exactly 20/80; it shows where that line falls in your own catalog.
How do you calculate ABC analysis?
Sort products by profit from largest to smallest, calculate each one's share of total profit, add the shares up as a running total and assign the group: up to 80% — A, up to 95% — B, the rest — C.
What is the formula for ABC analysis in Excel?
Three formulas: share =B2/SUM($B$2:$B$11), cumulative share =SUM($C$2:C2) and the group with IF at the 80% and 95% cut-offs. Full formulas and an example are in the Excel section.
What is an ABC analysis example?
A store with ten products ranks them by quarterly profit: four products bring 80% of profit and form group A, three bring the next 15% (B), three the last 5% (C). The full table, with the same products ranked by revenue for comparison, is in the example.
Should ABC analysis be based on revenue or profit?
For assortment and purchasing decisions, profit. Revenue shows turnover and units show warehouse load, but both push into group A products that earn little.
What can't ABC-XYZ analysis tell you?
It cannot judge new products or items that were out of stock, and it cannot explain why sales are low: it shows what happened in the period, not why. Those cases are checked separately.
Sources
- Microsoft Support, IF function — support.microsoft.com.
- Microsoft Support, ROUND function — support.microsoft.com.
Checked on October 31, 2026.


