

An assortment matrix is the list of products a store must always have for sale, with categories, price tiers, product roles, suppliers and minimum stock levels. You build it in seven steps: the customer, the category tree, width and depth, product roles, ABC analysis by profit, XYZ analysis by demand stability, and a decision for each item. The matrix then drives purchasing, catalog content and what to phase out.
The main mistake is building the matrix by gut feeling or straight from a supplier's catalog: money ends up in products that sell once a season, while bestsellers keep running out. Below: what a matrix is made of, a step-by-step calculation for an illustrative category of eight products, a ready table for Excel, and how to review the matrix.
When people look up assortment planning
Usually it is a store that has grown to a few hundred products: some sit for months, others are always out of stock, and the buyer reorders "same as last time". The searches go "assortment planning", "assortment planning template", "abc xyz analysis excel", and then "how to do assortment planning".
A template on its own will not help much: the columns are the same everywhere, and the "keep or drop" decision comes only from sales data. So below you get not only the table but also how to fill it in.
What an assortment matrix is, in simple terms
The assortment is everything the store has right now. The matrix is the plan: which products must always be there, in what quantity and why. The gap between the two shows stockouts (a matrix item has run out) and random items (a product is in stock but not in the matrix). A store does not buy products outside the matrix, even when a supplier offers a good deal.
Assortment matrix, assortment plan, product matrix: the same thing?
An assortment matrix and an assortment plan describe the same thing: what to carry and in what depth. "Product matrix" in retail means the same, but in strategy it usually refers to the BCG growth-share matrix with "stars", "cash cows", "question marks" and "dogs". The BCG matrix helps decide which business lines to invest in; the assortment matrix decides what to keep on the shelf.
What an assortment matrix is made of
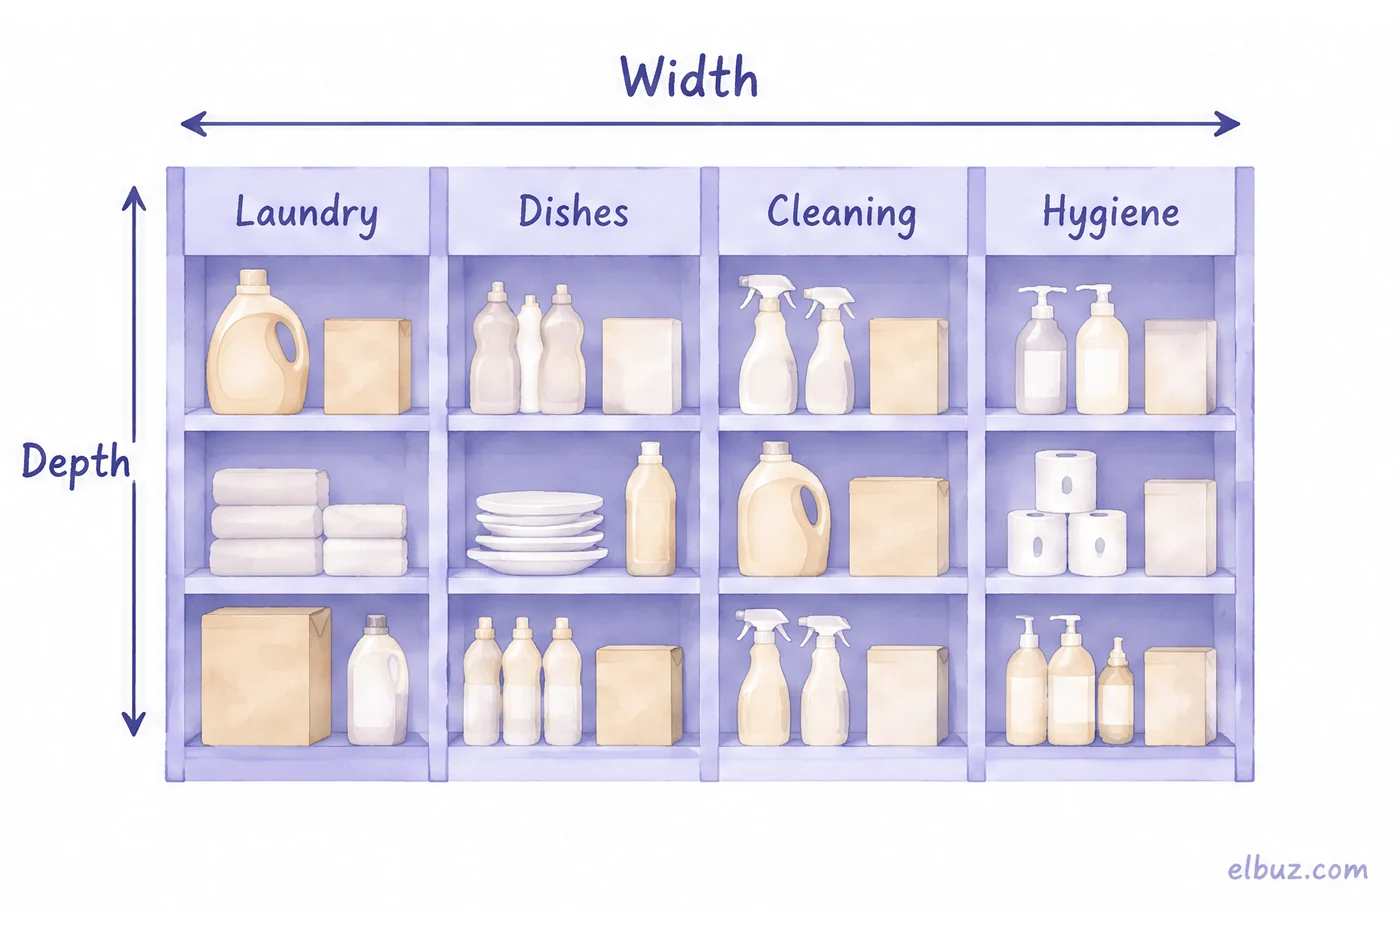
Six parameters describe a matrix: width, depth, price tier, product role, minimum stock and supplier.
| Parameter | What it means | Example for a household cleaning store |
|---|---|---|
| Width | Number of categories | Laundry, dishes, cleaning, hygiene — 4 categories |
| Depth | Number of items in a category | Laundry has 8 items: powders, liquids, pods, fabric softener, stain remover, bleach |
| Price tier | Value, mid-range, premium | A regular liquid detergent and a premium eco detergent |
| Product role | Why the product is in the range | A cheap powder brings customers in, a stain remover raises the basket |
| Minimum stock | The level at which you reorder | 30 boxes of powder |
| Supplier | Main and backup | Supplier A; if out of stock, Supplier B |
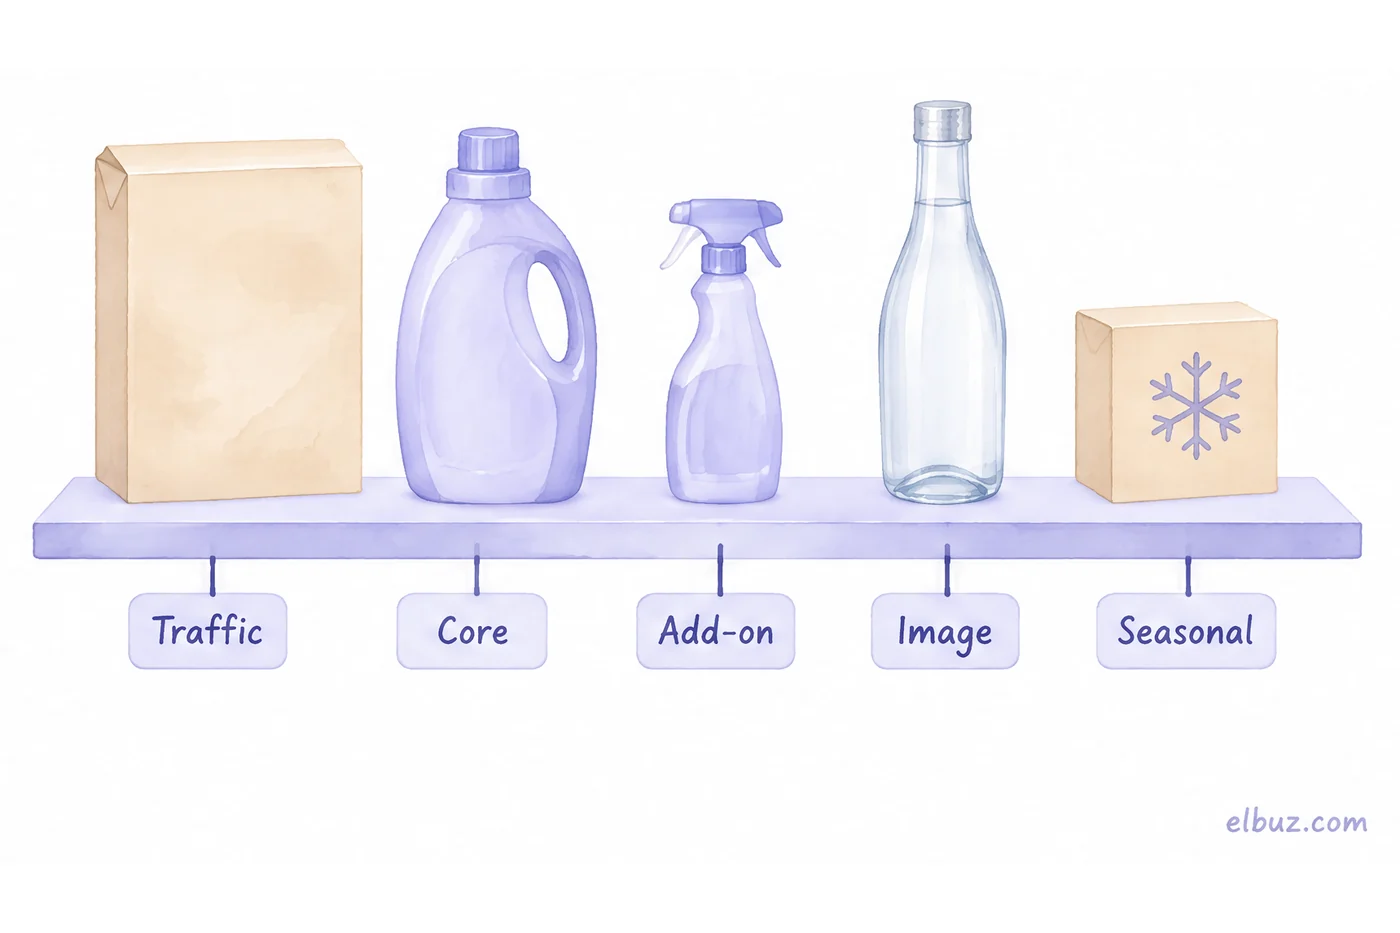
There are five product roles. The role decides how you judge a product: a traffic product does not have to earn much, a core product does.
- Traffic — the lowest price or the highest demand; people come for it. Low margin.
- Core — the base of the category's sales and profit.
- Add-on — bought together with the main item: a stain remover with detergent. Raises the basket.
- Image — an expensive or rare product that shapes how people see the store. Sells rarely.
- Seasonal — enters the matrix for the season and leaves after it.
How to build an assortment matrix: 7 steps with an example
The first four steps set the frame, the last three run on sales numbers. A new store without sales history uses competitors' range and supplier forecasts for steps 5–6, then repeats them on its own data after a quarter.
- Define the customer. Who the store is for and in which price tier. This cuts half of the unnecessary items.
- Build the category tree. Categories and subcategories the way customers search, not the way the supplier's file is organized.
- Set width and depth. How many items each subcategory needs so there is a choice by price, without two identical products in one tier.
- Assign roles. In each category: traffic, core and add-on products.
- Run an ABC analysis by profit. It shows which products earn money.
- Run an XYZ analysis by sales. It shows how steadily each product sells.
- Decide on each item and set minimum stock levels.
Illustrative example for the arithmetic, not market data. The "Laundry" category of a household cleaning store, eight products, sales for one quarter:
| Product | Profit, € | Cumulative share | ABC | Monthly sales, units | Coefficient of variation | XYZ |
|---|---|---|---|---|---|---|
| Laundry powder, 3 kg | 1,200 | 40.0% | A | 100 / 105 / 95 | 4.1% | X |
| Liquid detergent, 1.5 l | 800 | 66.7% | A | 60 / 70 / 50 | 13.6% | Y |
| Laundry pods, 30 pcs | 400 | 80.0% | A | 30 / 32 / 28 | 5.4% | X |
| Fabric softener, 1 l | 250 | 88.3% | B | 40 / 20 / 30 | 27.2% | Z |
| Stain remover spray | 150 | 93.3% | B | 15 / 16 / 14 | 5.4% | X |
| Bleach | 100 | 96.7% | C | 10 / 20 / 5 | 53.5% | Z |
| Baby laundry detergent | 60 | 98.7% | C | 8 / 9 / 8 | 5.7% | X |
| Premium eco detergent | 40 | 100% | C | 2 / 6 / 1 | 72.0% | Z |
Step 5: ABC analysis by profit
Sort products by profit from highest to lowest, calculate each one's share and the cumulative share. Common cut-offs: up to 80% of cumulative profit is group A, up to 95% is B, the rest is C. In the example the category's total profit is €3,000: the first three products make €2,400, which is 80%, so they are group A. Fabric softener and stain remover bring the share to 93.3% — group B; the last three are C.
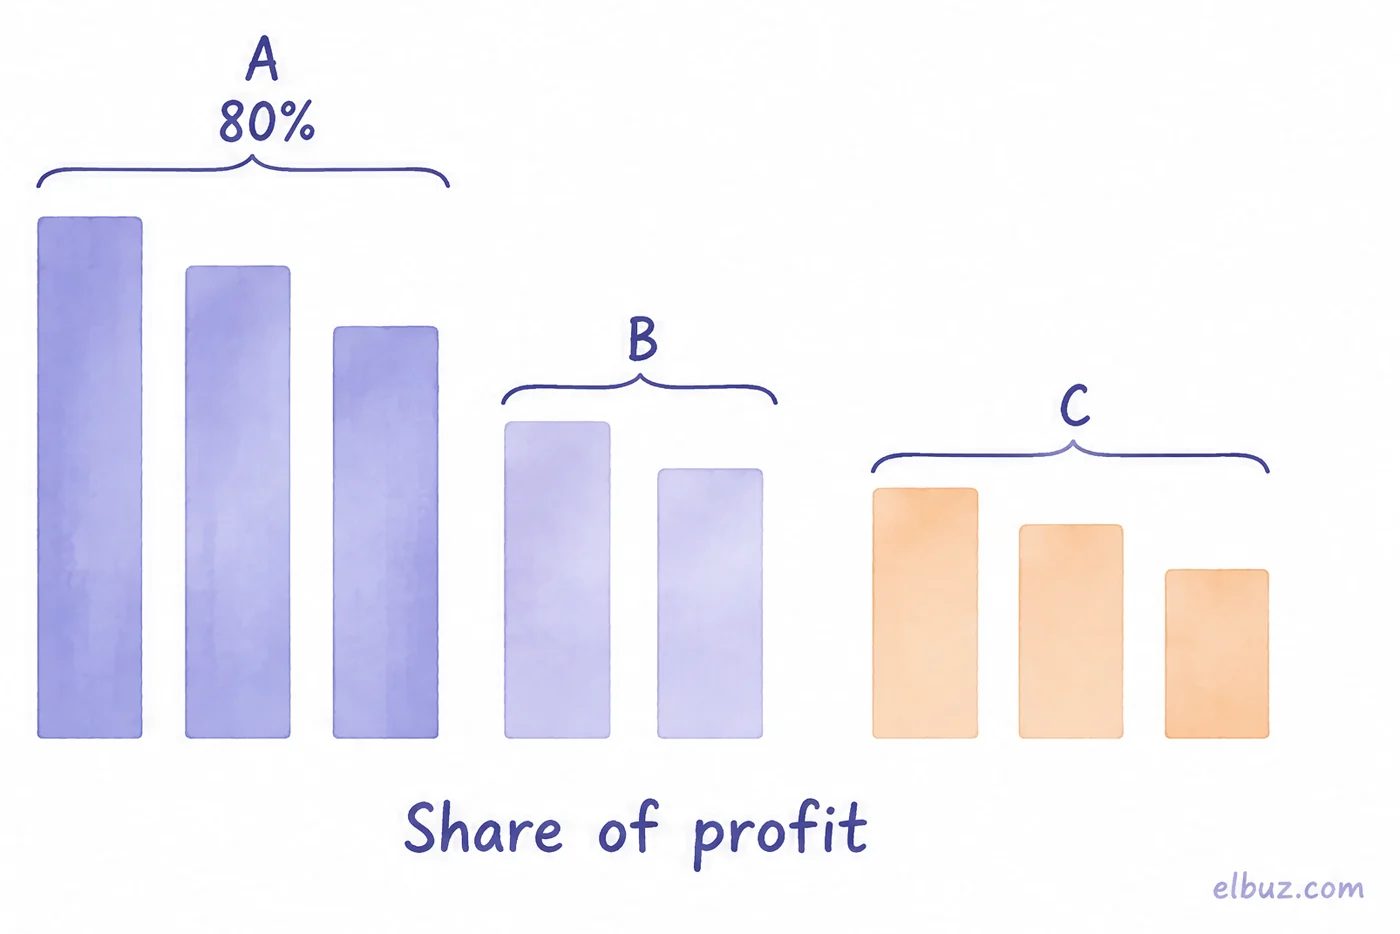
Rank by profit, not revenue: a cheap traffic product can be first by revenue and last by profit. More on the method in ABC analysis of product profitability.
Step 6: XYZ analysis by demand stability
Coefficient of variation = standard deviation of sales ÷ average sales × 100%. The lower it is, the more evenly the product sells. Common thresholds: up to 10% is X, 10–25% is Y, above 25% is Z; in practice you adjust them to the category's seasonality.
For the liquid detergent: average sales (60 + 70 + 50) ÷ 3 = 60 units. Deviations from the average are 0, +10 and −10, the mean of squared deviations is (0 + 100 + 100) ÷ 3 ≈ 66.7, and its square root ≈ 8.2. The coefficient is 8.2 ÷ 60 ≈ 13.6% — group Y. In Excel or Google Sheets the formula =STDEV.P(B2:D2)/AVERAGE(B2:D2) does the same, where B2:D2 are the product's monthly sales. Three months is the minimum for an example; for real decisions take six to twelve.
Step 7: a decision for each ABC/XYZ cell
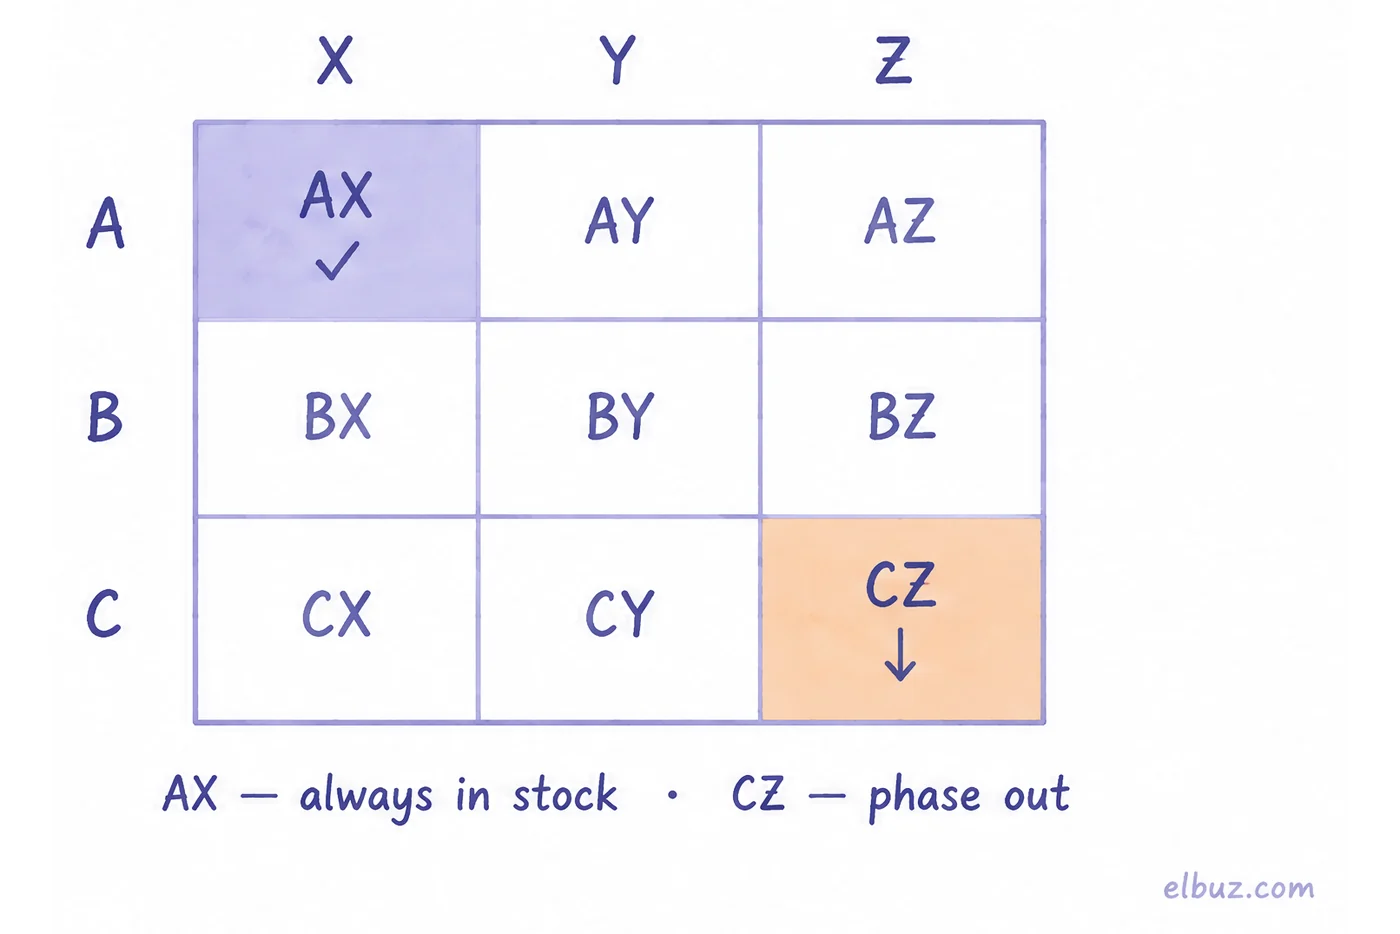
Combine the two letters and you get nine cells, each with its own purchasing rule.
| Cell | Products from the example | Decision |
|---|---|---|
| AX | Powder, pods | Always in stock, reorder at minimum stock, small safety stock |
| AY | Liquid detergent | Always in stock, larger safety stock to cover demand swings |
| BX | Stain remover | Keep: a steady add-on product |
| BZ | Fabric softener | Find the reason for the spikes (a promotion, the supplier being out); buy to demand |
| CX | Baby detergent | Keep with minimal stock if your customers need it |
| CZ | Bleach, eco detergent | Candidates to phase out or sell to order |
Before dropping a CZ product, check its role. The eco detergent in the example is a premium image product: you do not hold stock of it, but you keep it on the website and sell it to order. Bleach has no special role, so it goes.
Minimum stock is calculated as average daily sales × supplier lead time in days + safety stock. Powder: 100 units a month ÷ 30 ≈ 3.3 a day; with a 7-day lead time that is ≈ 23 units, plus 7 units of safety stock — 30 in total.
Assortment matrix example: an Excel layout
A finished matrix is a table with one row per item. You can copy the columns into Excel or Google Sheets as a template; the last column is a status that keeps the matrix alive: "New" — a product on trial, "In matrix" — must be in stock, "To order", "Phase out" — sell through and stop buying.
| Product | Tier | Role | ABC/XYZ | Supplier | Min. stock | Status |
|---|---|---|---|---|---|---|
| Laundry powder, 3 kg | Value | Traffic | AX | Supplier A | 30 | In matrix |
| Liquid detergent, 1.5 l | Mid-range | Core | AY | Supplier A | 20 | In matrix |
| Laundry pods, 30 pcs | Mid-range | Core | AX | Supplier B | 10 | In matrix |
| Fabric softener, 1 l | Mid-range | Add-on | BZ | Supplier A | 12 | In matrix |
| Stain remover spray | Mid-range | Add-on | BX | Supplier B | 5 | In matrix |
| Bleach | Value | Core | CZ | Supplier A | 0 | Phase out |
| Baby laundry detergent | Mid-range | Core | CX | Supplier B | 3 | In matrix |
| Premium eco detergent | Premium | Image | CZ | Supplier B | 0 | To order |
How to review the matrix: dead stock, stockouts and new products
Review the matrix monthly or quarterly, and seasonal categories before every season. Besides repeating ABC/XYZ, run three checks:
- Dead stock. Products with no sales for one to two months. What to do with them is covered in the article on getting rid of dead stock.
- Stockouts. Group A products that are regularly unavailable: change the minimum stock or the supplier. What an empty shelf costs is covered in how to prevent out-of-stock losses.
- New products. New items in supplier price lists are matrix candidates with the "New" status. After a quarter they go through the same ABC/XYZ.
When to keep the matrix in inventory software
When you have hundreds of products and several suppliers: a monthly ABC and a dead-stock check in a spreadsheet then take a day, and sales and stock data have to be exported and combined every time.
In Elbuz the matrix lives in the catalog itself, where categories, suppliers and prices already are. The sales report calculates ABC analysis by profit on its own, shows products with no movement for more than 30 days and items with critically low stock. Products from supplier price lists that are not in your catalog show up as new items, which are candidates for expanding the matrix. How supplier files feed the catalog is described on the supplier feeds automation page.
An honest caveat: the report has no XYZ analysis, so you will calculate the coefficient of variation in a spreadsheet with the formula above. And if you have a few dozen products, the Excel layout from this article is enough for now.
Assortment with ElbuzSupplier price lists, catalog and sales analytics, 14 days free
Frequently asked questions
What is an assortment matrix?
The list of products a store must always have for sale, with categories, price tiers, roles, suppliers and minimum stock levels. Purchasing and catalog content follow it.
What is assortment in retail?
The full set of products a store offers right now, described by width (number of categories), depth (items per category) and price range. The matrix is the plan for that assortment; the gap between them shows stockouts and random items.
What is the difference between ABC and XYZ analysis?
ABC ranks products by how much profit or revenue they bring; XYZ ranks them by how steady their demand is, using the coefficient of variation. Together they give nine cells, from AX (valuable and steady) to CZ (low value and erratic).
How often should you review an assortment matrix?
Monthly or quarterly based on sales, and seasonal categories before every season. Check stockouts of group A products weekly.
How do you build an assortment matrix in Excel?
One row per item, with columns for product, tier, role, ABC/XYZ, supplier, minimum stock and status. For XYZ use =STDEV.P(…)/AVERAGE(…) over monthly sales.
What is the BCG product matrix?
A strategy tool that splits products or business units by market growth and relative market share into stars, cash cows, question marks and dogs. It tells you where to invest, not what to keep in stock.
Sources
- STDEV.P function in Excel — support.microsoft.com.
- BCG growth-share matrix — bcg.com/about/overview/our-history/growth-share-matrix.
Checked on October 31, 2026.


