

A SWOT analysis for an online store is a table of four boxes: strengths and weaknesses (what happens inside the store and depends on you) and opportunities and threats (what happens in the market). It becomes useful only when every line is backed by a number and turned into an action: what you do, which metric you watch and by what date.
Most SWOT tables end with a list like "wide range, weak marketing, ecommerce is growing, competitors" — and change nothing. Below is a five-step process, an example built on one illustrative store, a way to tell an important factor from noise, and a table that turns SWOT into a work plan.
When a store does a SWOT analysis
Usually before a decision: writing a business plan, going onto a marketplace, opening a new product line, raising prices. Or when sales have stalled and it is not clear what to tackle first. People search for "swot analysis example" and "swot analysis for ecommerce", and then ask what counts as a strength, how an opportunity differs from a strength, and how to draw conclusions.
The last question matters most. Filling four boxes takes half an hour; deciding which of twenty lines is worth money and time is the hard part. That is why this article spends more space on scoring and the plan than on the quadrants themselves.
What goes in each quadrant
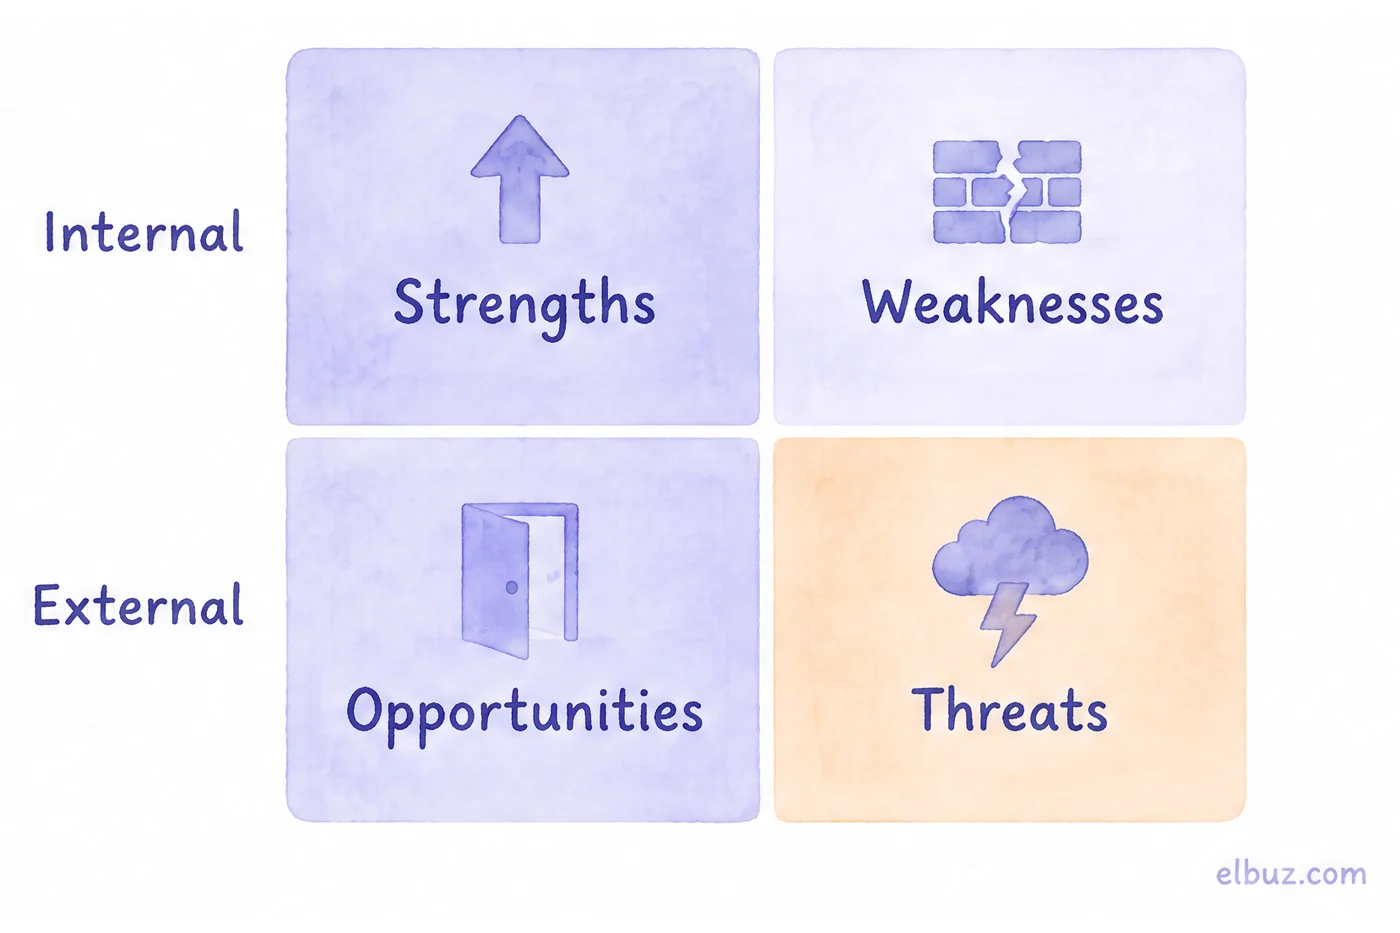
The split is simple: the top row holds internal factors that you can change with an owner's decision; the bottom row holds external ones that you can only use or protect yourself from. If a point does not depend on you, it cannot be a strength or a weakness.
| Quadrant | Where to look | Question | Store example |
|---|---|---|---|
| S — strengths | internal | What do we do better than competitors, in a way shoppers notice? | same-day dispatch, supplier prices below the market |
| W — weaknesses | internal | Where do we lose money or customers? | expensive ads per order, prices from supplier lists updated by hand |
| O — opportunities | external | What has changed in the market that could bring us sales? | a new marketplace in the niche, a competitor closed, seasonal demand |
| T — threats | external | What could take sales or margin away through no fault of ours? | rising ad costs, supplier price increases, a strong new competitor |
A check for every line: does the shopper see it, and can it be counted? "Great service" without a number is an opinion; "we ship on the day of the order, and the five nearest competitors ship the next day" is a strength.
How to do a SWOT analysis in five steps
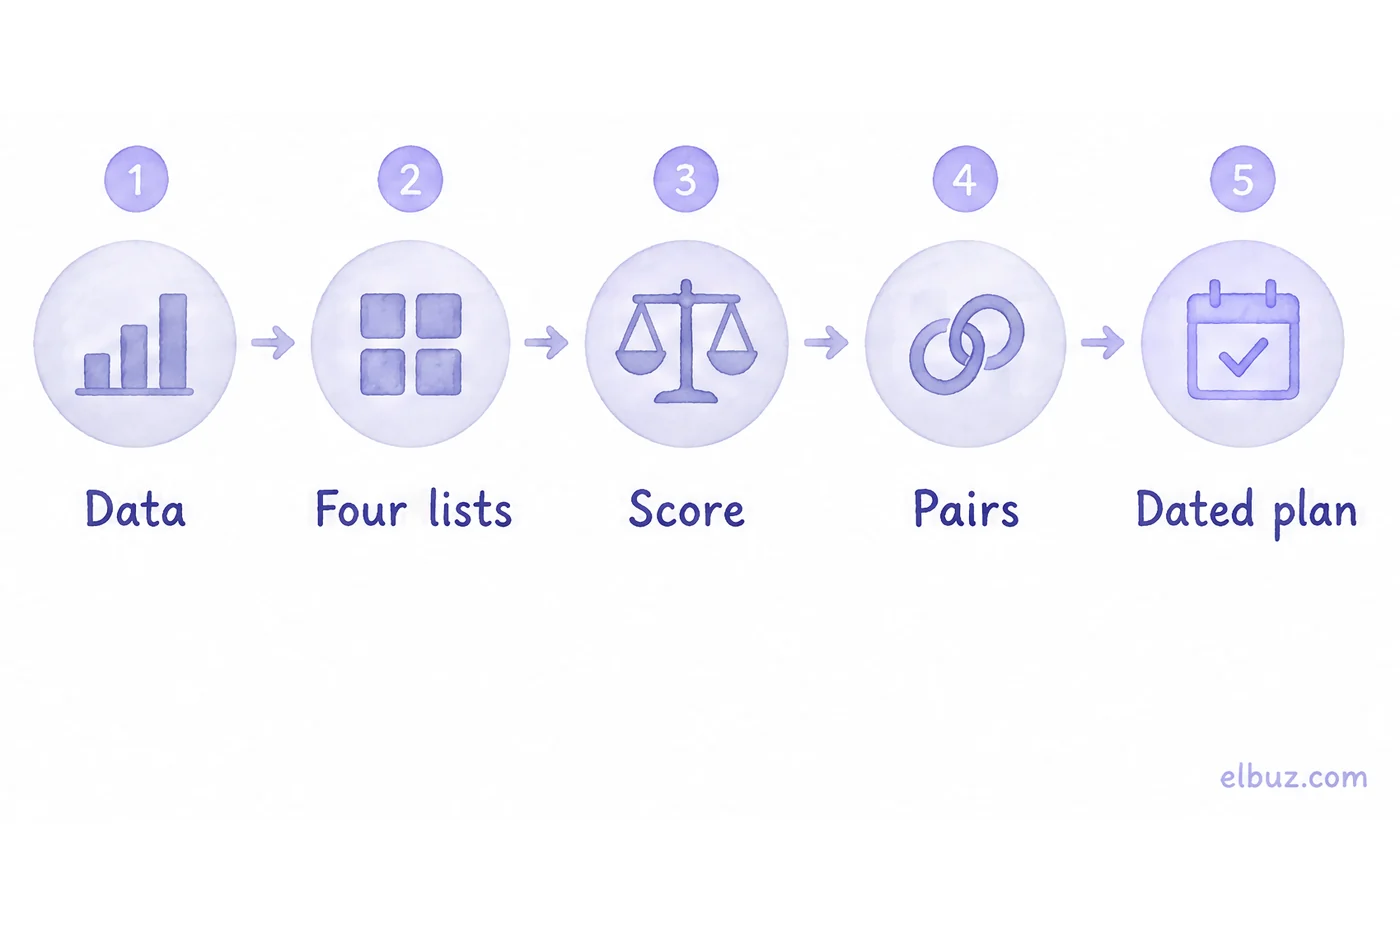
Start with data, not brainstorming: first the store's numbers for the last 3–6 months, then the quadrants, then scoring and the plan.
- Collect the data. Sales and margin by channel, ad cost per order, return rate, prices of 5–10 competitors on your best sellers, customer reviews. Check: each quadrant has at least one number.
- Fill in four lists. 3–6 points per quadrant, short and specific. Bring in people who see different things: the person who answers customers, the warehouse, whoever runs the ads.
- Score each point. How much does it change the store's money — that is the next section. Check: every point has a score, not just a name.
- Make pairs. Strength + opportunity, weakness + threat and so on — this is the cross analysis (TOWS matrix), and actions come out of it.
- Write a plan with dates. Action, owner, metric, deadline. After a quarter, compare the metrics and update the table.
SWOT analysis example for an online store
Illustrative example for the arithmetic, not market prices. The same store as in the articles on the ecommerce business plan and the break-even point: an average order of €50, a plan of 1,000 orders a month, €12 of contribution margin left from each order, ads at €4 per order, fixed costs of €6,500 a month. The store breaks even at 542 orders.
| Quadrant | Point | What backs it up |
|---|---|---|
| S | Buys from the supplier cheaper than most competitors | goods at €30 with a selling price of €50 |
| S | Ships on the day of the order | share of orders shipped the same day |
| W | Depends on paid ads | €4 of the €16 an order brings before ads goes to ads |
| W | Prices from the supplier's price list are updated by hand once a week | products sold at the old price after a supplier increase |
| O | Shoppers search for the product on marketplaces more often | number of reviews on category leaders on the marketplace |
| O | Seasonal growth of demand in the niche | Google Trends for past years |
| T | Ad costs in the niche are rising | cost per click over recent months |
| T | The supplier raises prices more than once a month | price list history |
Look at the "What backs it up" column. Without it the table is a set of opinions, and everyone in the meeting agrees with everything. With it, you see right away that two points out of eight have not been checked by anyone.
How to tell which factor matters most
Translate the factor into a number from the plan: by how many orders it moves the break-even point, or by how many euros it changes profit. The bigger the shift, the higher the point goes on the list. For the illustrative store, the formula from the break-even article does the job.
| Factor | Quadrant | Margin per order, € | Break-even, orders | Profit at 1,000 orders, € |
|---|---|---|---|---|
| As planned | 12 | 542 | 5,500 | |
| Ads €6 per order instead of €4 | T | 10 | 650 | 3,500 |
| Fixed costs +€1,000 | W | 12 | 625 | 4,500 |
| Purchase price −5% | S | 13.50 | 482 | 7,000 |
| Selling prices +5% | O | 14.35 | 453 | 7,850 |
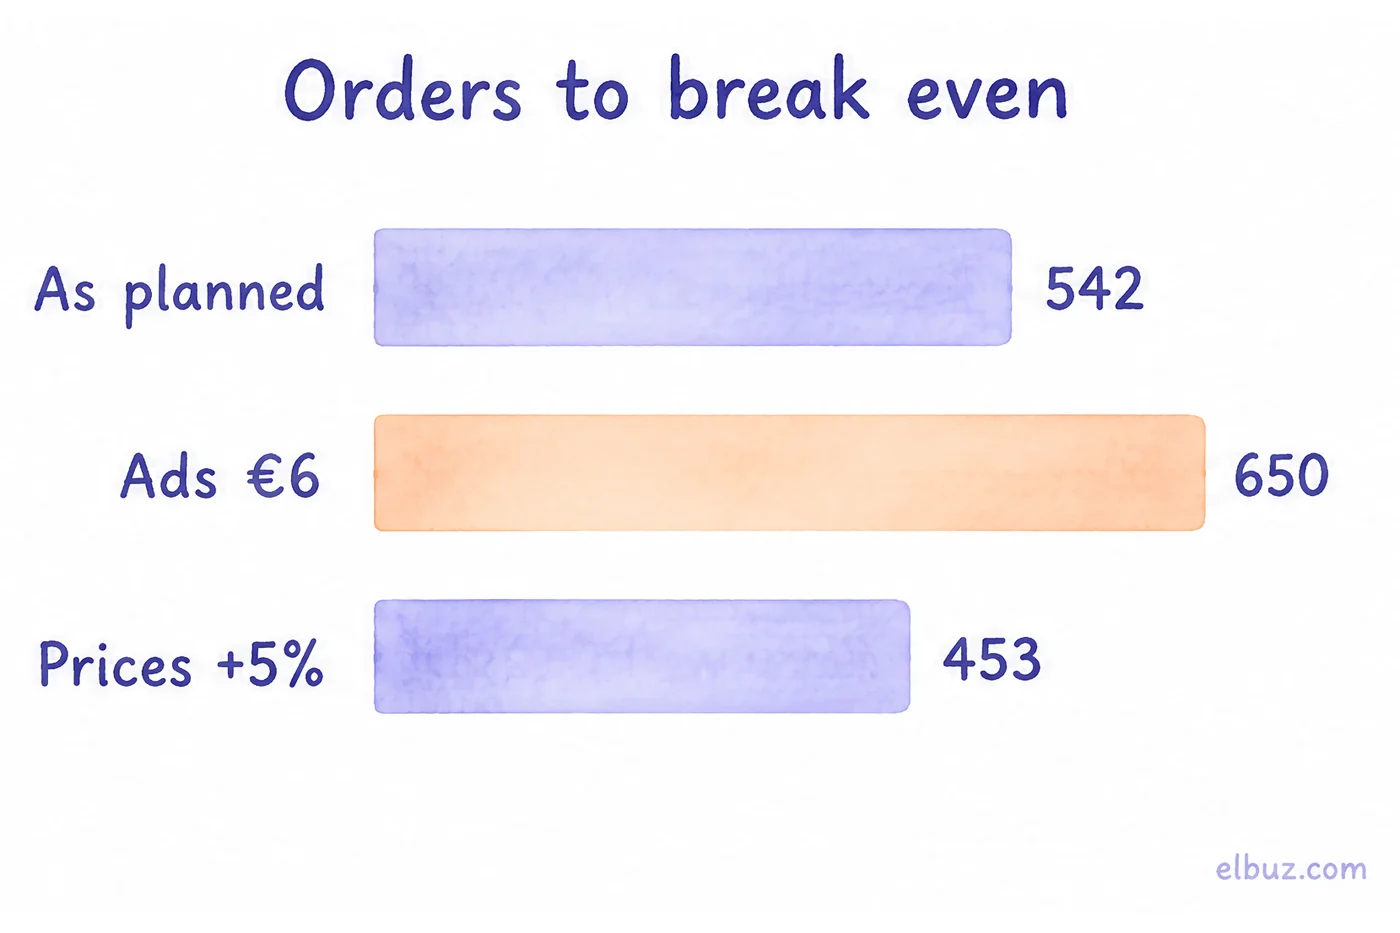
The conclusion for this store: the main threat is rising ad costs. €2 more per order eats 36% of profit, while €1,000 more of rent or salaries eats 18%. So the plan starts with actions that reduce dependence on ads, not with a search for a cheaper warehouse. With prices +5%, the 6% fee takes €0.15 of the extra €2.50, and the rest goes to profit.
For points that do not translate into money directly (brand, team), give two scores from 1 to 3: how strong the impact is and how likely it is. A product of 6–9 goes into this quarter's plan, 3–4 — watch, 1–2 — remove from the table.
How to turn SWOT into an action plan
Pair factors from different quadrants and write an action for each pair: strength + opportunity — attack, weakness + opportunity — fix, strength + threat — defend, weakness + threat — avoid. This step is called cross analysis, or the TOWS matrix.
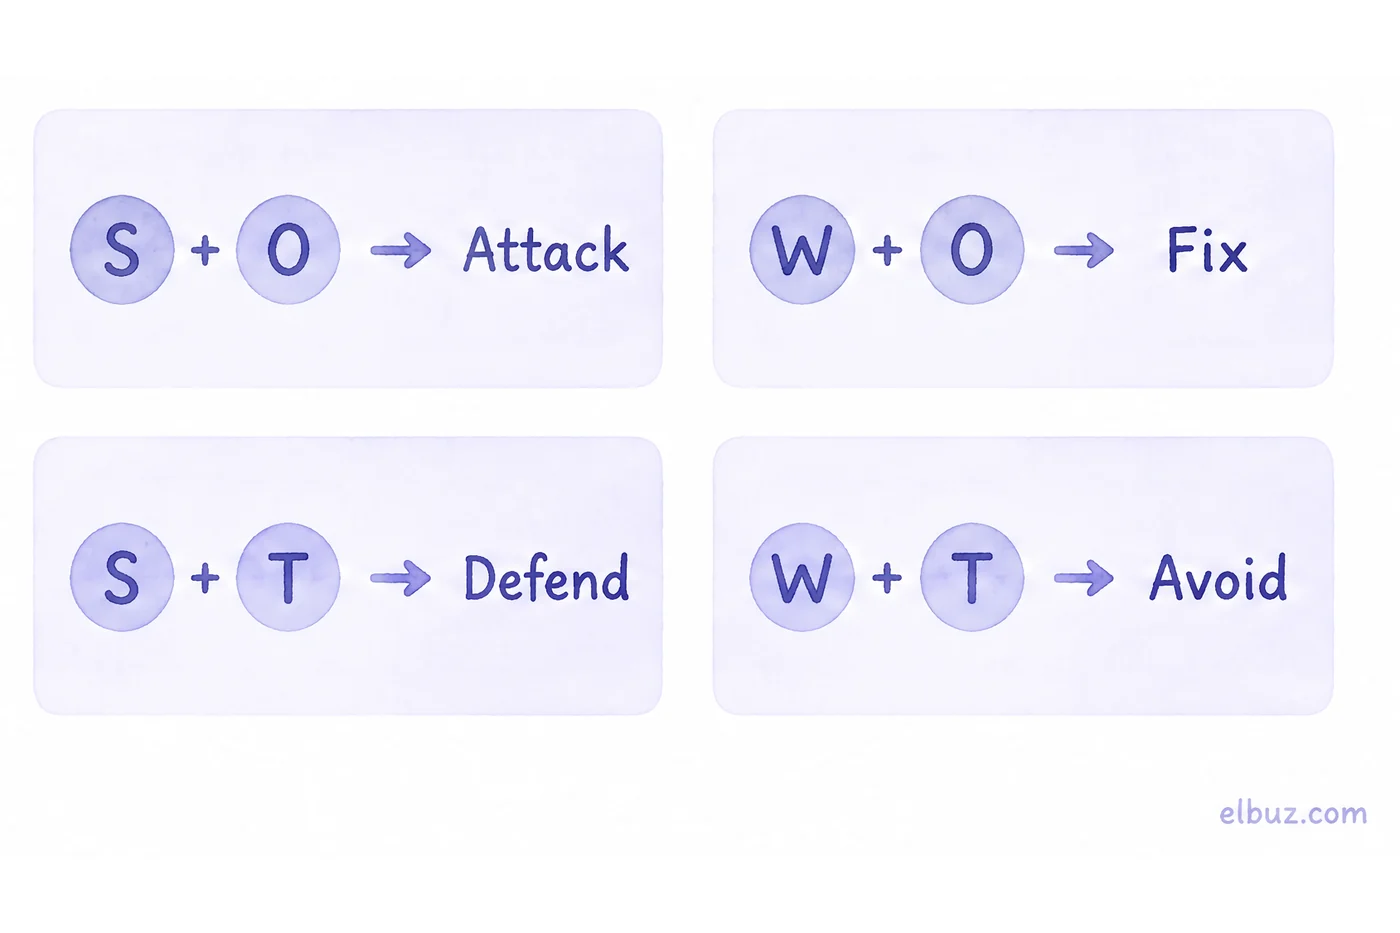
| Pair | Action | Metric | Deadline |
|---|---|---|---|
| S + O: low purchase price + shoppers on marketplaces | List 50 best sellers on one marketplace | orders from the marketplace and margin per order after its fee | 2 months |
| W + O: dependence on ads + seasonal demand | Before the season, build a customer list and an email flow so repeat orders come without ads | share of repeat orders | before the season starts |
| S + T: same-day dispatch + pricier ads | Show fast dispatch in ads and on the product page to raise conversion on the same budget | ad cost per order | 1 month |
| W + T: manual prices + frequent supplier increases | Update prices with every price list and set a price floor | sales below cost in a month — 0 | 1 month |
Each action has one metric, and it is tied to a number from the previous section. After a quarter you check not "whether marketing got better" but a specific figure: what an order from ads costs and what share of orders is repeat.
Where SWOT analysis does not work
- External factors listed as strengths. "The market is growing" is an opportunity, and it is the same for every competitor. Result: the store believes it has an advantage it does not have.
- Generic words. "Good service", "weak marketing". Result: no action comes out of such points.
- Twenty points without scores. Everything looks equally important. Result: people take on the easiest item, not the most expensive one.
- No competitors in the analysis. A strength is something you do better than others. Without the prices and terms of 5–10 competitors you only have a description of yourself.
- Done once. Threats and opportunities change every quarter. Result: the plan rests on a market that no longer exists.
When the weakness is prices from supplier lists
If your table, like the example, has "we update supplier prices by hand" and the threat "the supplier raises prices often", it is closed by a setting, not a meeting. In Elbuz, prices are recalculated with every new price list by your markup rules, and a pricing formula can keep the price within limits, so a product is not sold below cost. If you have a few dozen products and the price list changes once a month, a spreadsheet with a formula is enough.
Frequently asked questions
What is a SWOT analysis in simple terms?
It is a table of four parts: what is strong in the store, what is weak, what chances the market gives and what threatens it. It helps you decide what to tackle first.
What are the internal and external factors in a SWOT analysis?
Strengths and weaknesses are internal: they depend on your decisions. Opportunities and threats are external: market changes, competitors, suppliers, ad prices.
What are examples of strengths for an online store?
Things that depend on you and that shoppers notice as better than at competitors: purchase price, dispatch speed, products others do not have, return terms. Back each strength with a number.
How is an opportunity different from a strength?
A strength is inside the store and belongs only to you. An opportunity is an external change your competitors see too: a new marketplace, seasonal demand, a competitor closing.
What is a TOWS matrix?
It is the step after filling in the table: factors from different quadrants are paired, and an action is written for each pair. An example is in the section how to turn SWOT into an action plan.
How often should a store do a SWOT analysis?
Once a quarter and before big decisions: a new sales channel, a price change, a new product line. Between reviews, comparing the metrics from the action plan is enough.


